<img height="1" width="1" style="display:none;" alt="" src="https://px.ads.linkedin.com/collect/?pid=598321&amp;fmt=gif">
Skip to content

InnerSpace Recognized as Deloitte’s Fast 50™ Companies-to-Watch Winner for 2024  Learn More

Behavior insights that help make people count.

Smart workplace planning starts with data, not guesswork. InnerSpace gives you real insights into how your spaces are actually used - from portfolio to desk -  so you can make informed decisions that align with employee behavior, improve space efficiency, and support evolving hybrid strategies.

When you plan with data, every square foot works harder and your people count more.

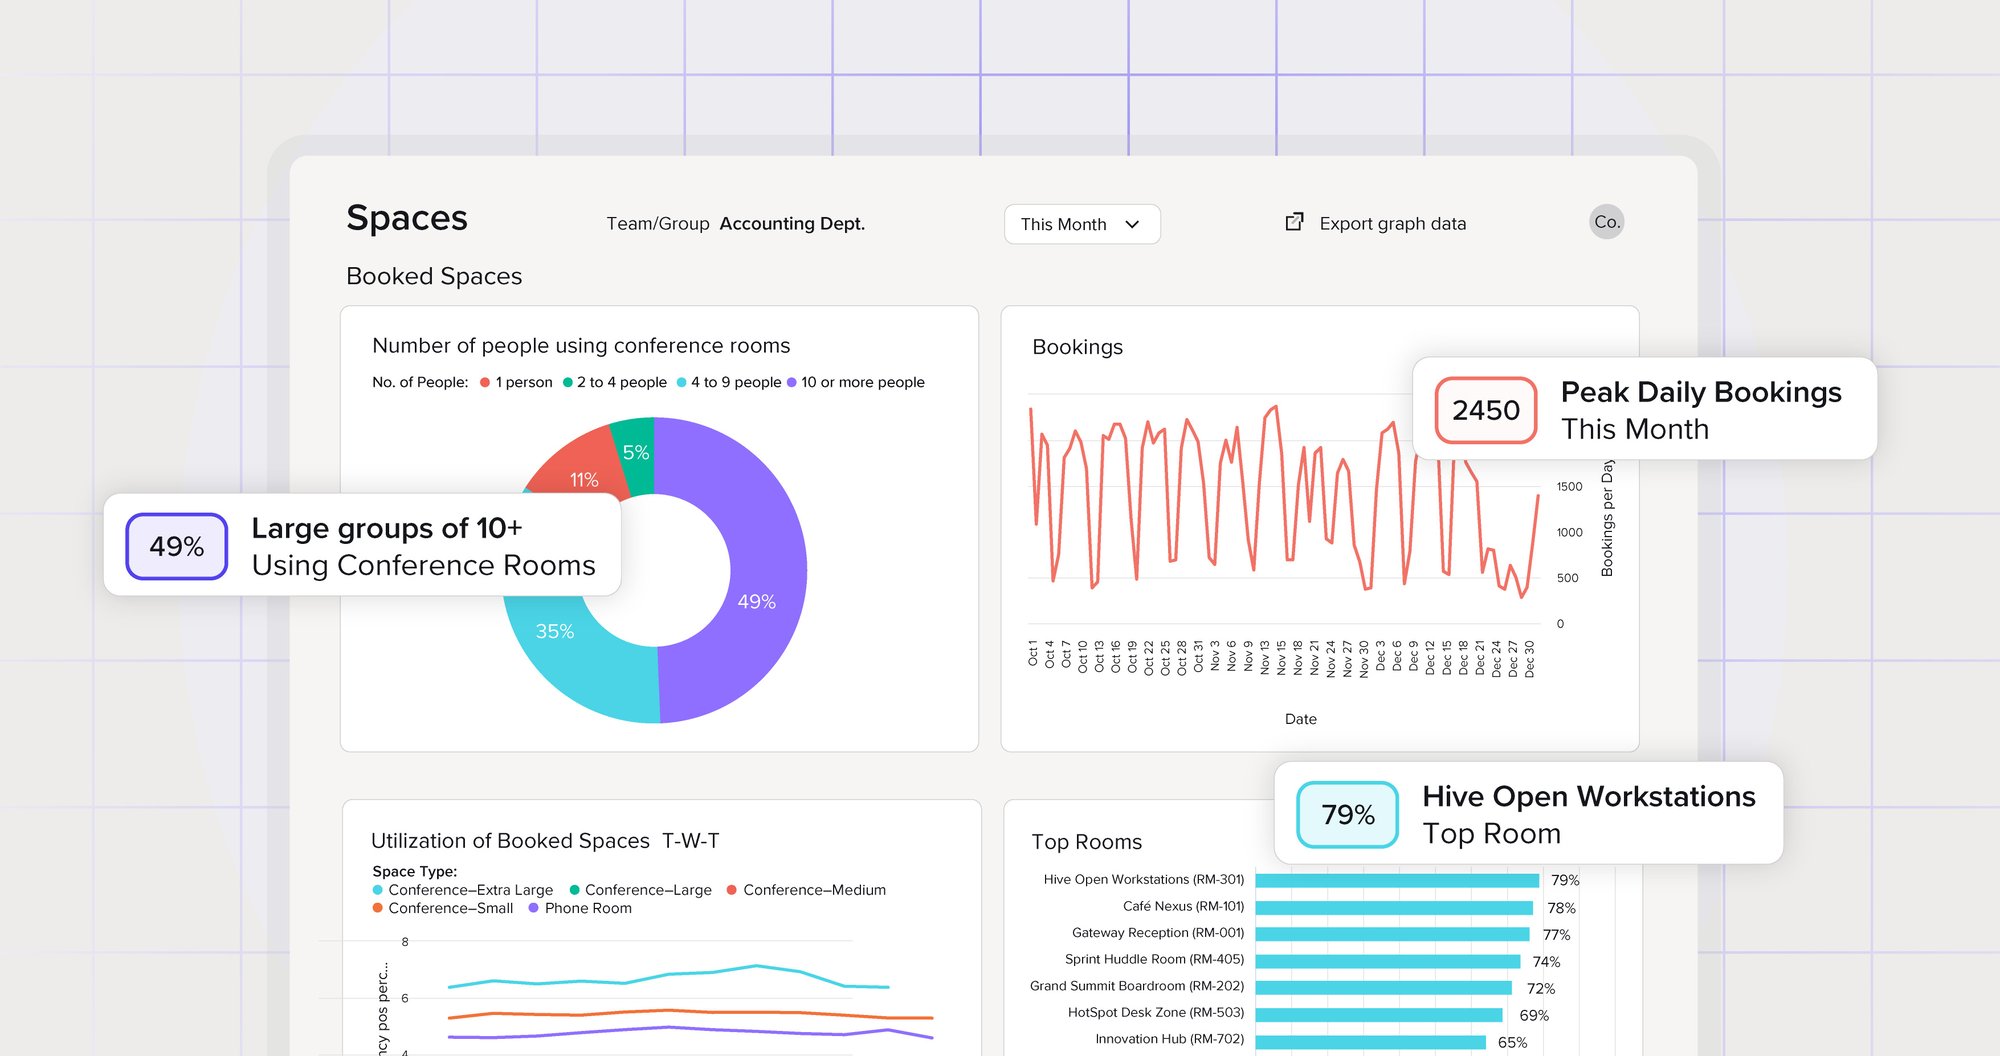
A workplace analytics dashboard displays booked space insights, including conference room occupancy, booking trends, utilization by room type, and top-performing spaces. Key highlights show 49% of conference rooms used by groups of 10+, 2,450 peak daily bookings, and 79% utilization for the most-used workstation.

Are you designing your workplace around how people actually work?

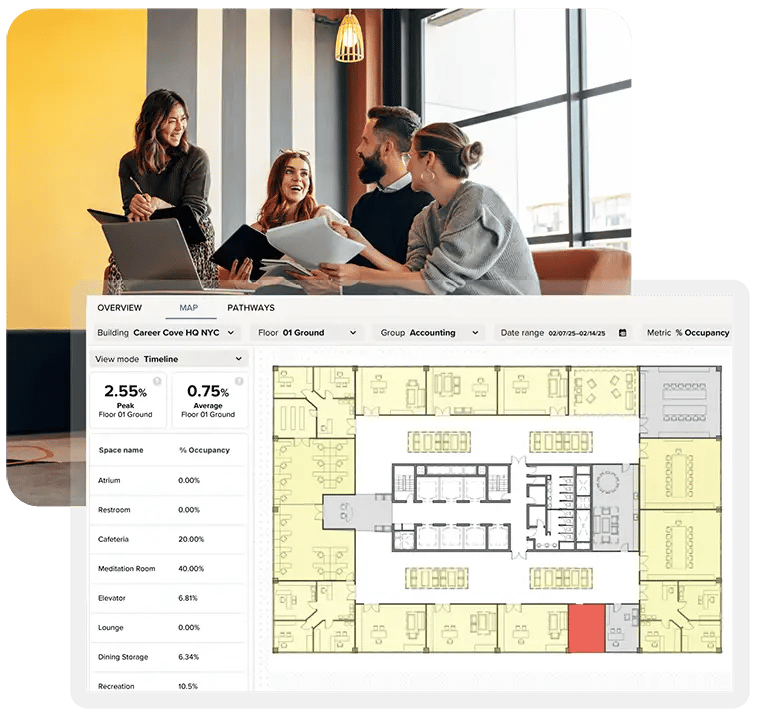
A modern workplace analytics dashboard is overlaid on a collaborative office scene. Employees meet and share ideas while an interactive floor plan displays real-time occupancy, space utilization, and room-level insights, helping workplace teams visualize usage patterns and optimize office performance.

Office use has changed - understanding its impact on space design and productivity is critical. You can rely on assumptions, or use data that makes it clear.


Great workplace design starts with understanding human behavior. It’s not just about desks and meeting rooms, it’s about movement, interaction, and intent.

If you want your workplaces to support productivity, connection, and well-being, you have to understand what people actually do when they’re in the office. That’s where InnerSpace comes in.


The InnerSpace Impact

“With InnerSpace we can easily understand the economics of every square foot within our business and make better decisions on how to utilize our space. The opportunity for growth is massive and they’ve cracked the code.”
steelcase

Drive confident decision making with reliable, accurate, objective and always on data.

A professional stands by a glass office wall, smiling while holding a smartphone. The bright, modern workspace reflects a connected employee experience, where mobile access to workplace information and real-time insights supports flexible work, collaboration, and everyday productivity.

DWELL TIME


  • How long employees or visitors spend in specific areas.
  • Identifies high-traffic zones vs. underutilized spaces.
  • Captures patterns of space usage throughout the day.
A team of professionals meets in a modern conference room to discuss schedules, projects, and workplace planning. A presentation screen displays a meeting calendar while participants collaborate around the table, representing efficient meeting room utilization, workplace coordination, and data-driven decision-making.

MEETING ROOM UTILIZATION


  • Frequency and duration of meeting room usage.
  • Identifies underused or overbooked rooms.
  • Tracks no-shows and abandoned bookings.
Employees walk through a busy modern office, illustrating workplace mobility and movement patterns. The dynamic scene represents how people navigate shared spaces throughout the day, providing occupancy and traffic insights that help organizations optimize layouts, improve employee flow, and enhance workplace efficiency.

MOBILITY PATTERNS


  • Collaboration patterns through mobility data to inform smarter organizational design
  • Tracks common pathways, congestion points, and bottlenecks.
  • Identifies which spaces encourage movement and collaboration.
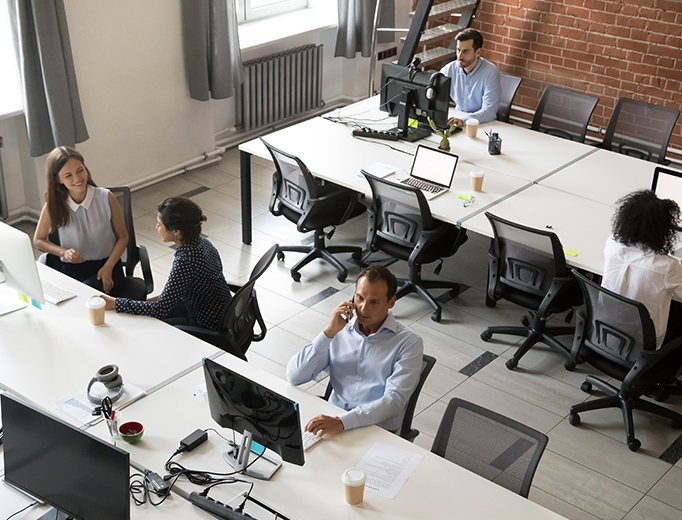
Employees work and collaborate in an open office with desks, computers, and meeting areas. Some people are seated at workstations while others talk or take calls, illustrating real-world occupancy patterns and workplace utilization that help organizations measure attendance, optimize space, and improve office planning.

OCCUPANCY TRENDS


  • Real-time and historical space utilization.
  • Tracks peak and low-traffic periods.
  • Identifies patterns in office attendance over time.

Data visualization made simple

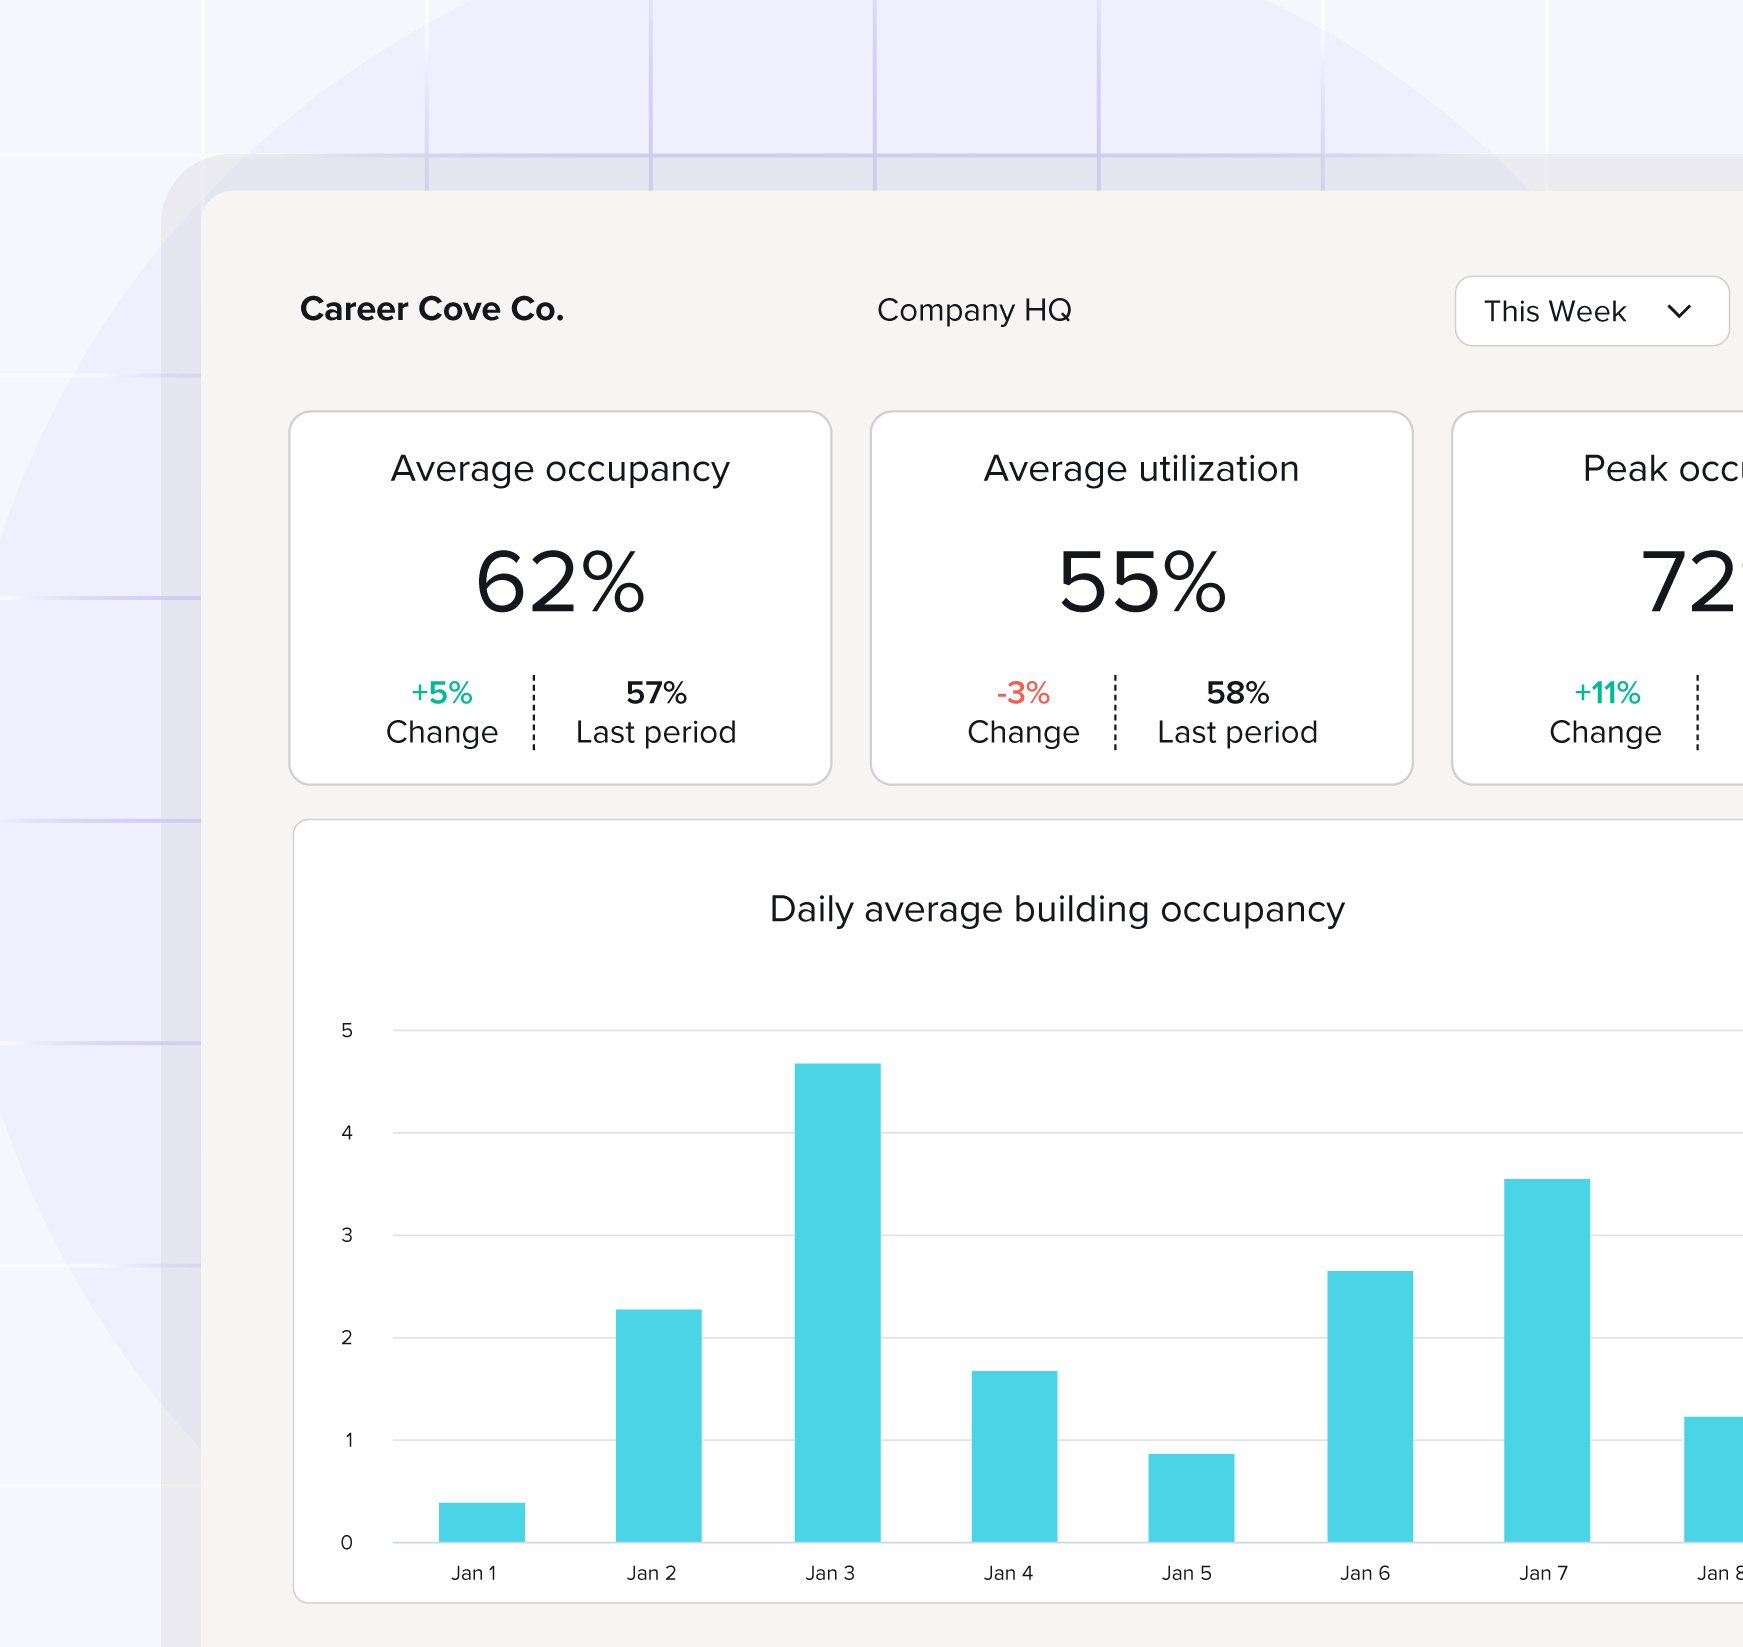
Dashboard displaying workplace occupancy analytics for a company headquarters. KPI cards highlight 62% average occupancy, 55% average utilization, and 72% peak occupancy, with period-over-period changes. A bar chart below shows daily average building occupancy trends for the selected week.

User-friendly interface


The InnerSpace Portal features a series of simple ‘cards’ presenting answers to common questions about space usage. This at-a-glance simplicity is augmented with detailed charts and graphs that present the full spectrum of historical data for reference over periods of time.

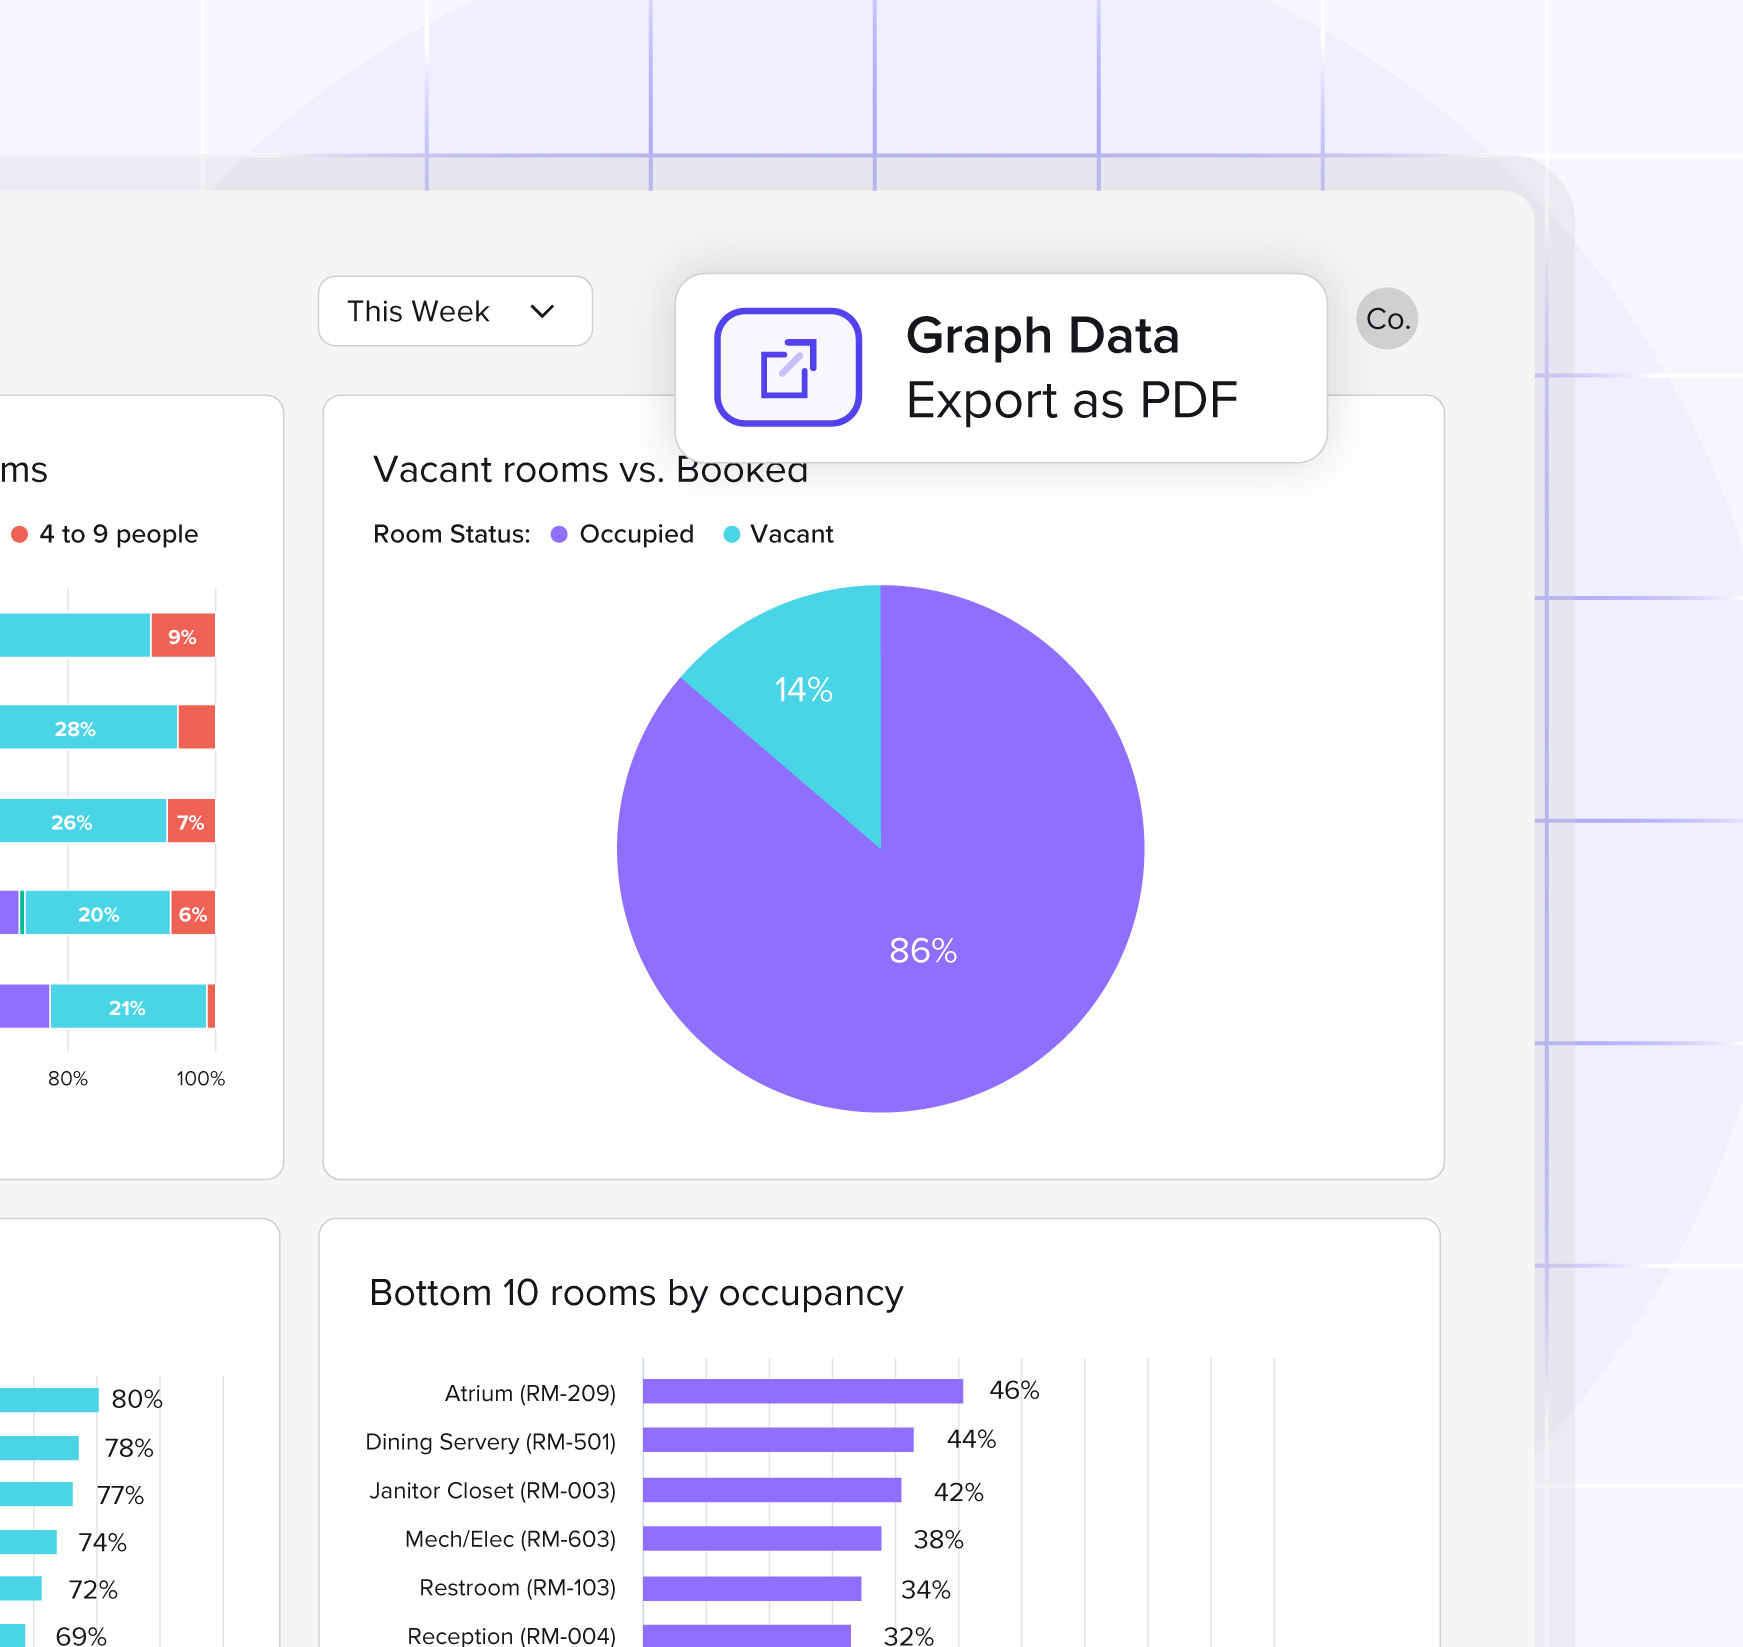
Workplace analytics dashboard showing meeting room occupancy insights. A pie chart indicates 86% of rooms are occupied and 14% are vacant, with charts ranking the top and bottom rooms by occupancy. An export option allows graph data to be downloaded as a PDF for reporting.
Intuitive dashboard design


An intuitive dashboard design empowers users to select the most important metric to them and export data for their own reporting needs. All graphs and charts in the InnerSpace Portal are available for CSV download, along with a high-level summary PDF report to share with key stakeholders.

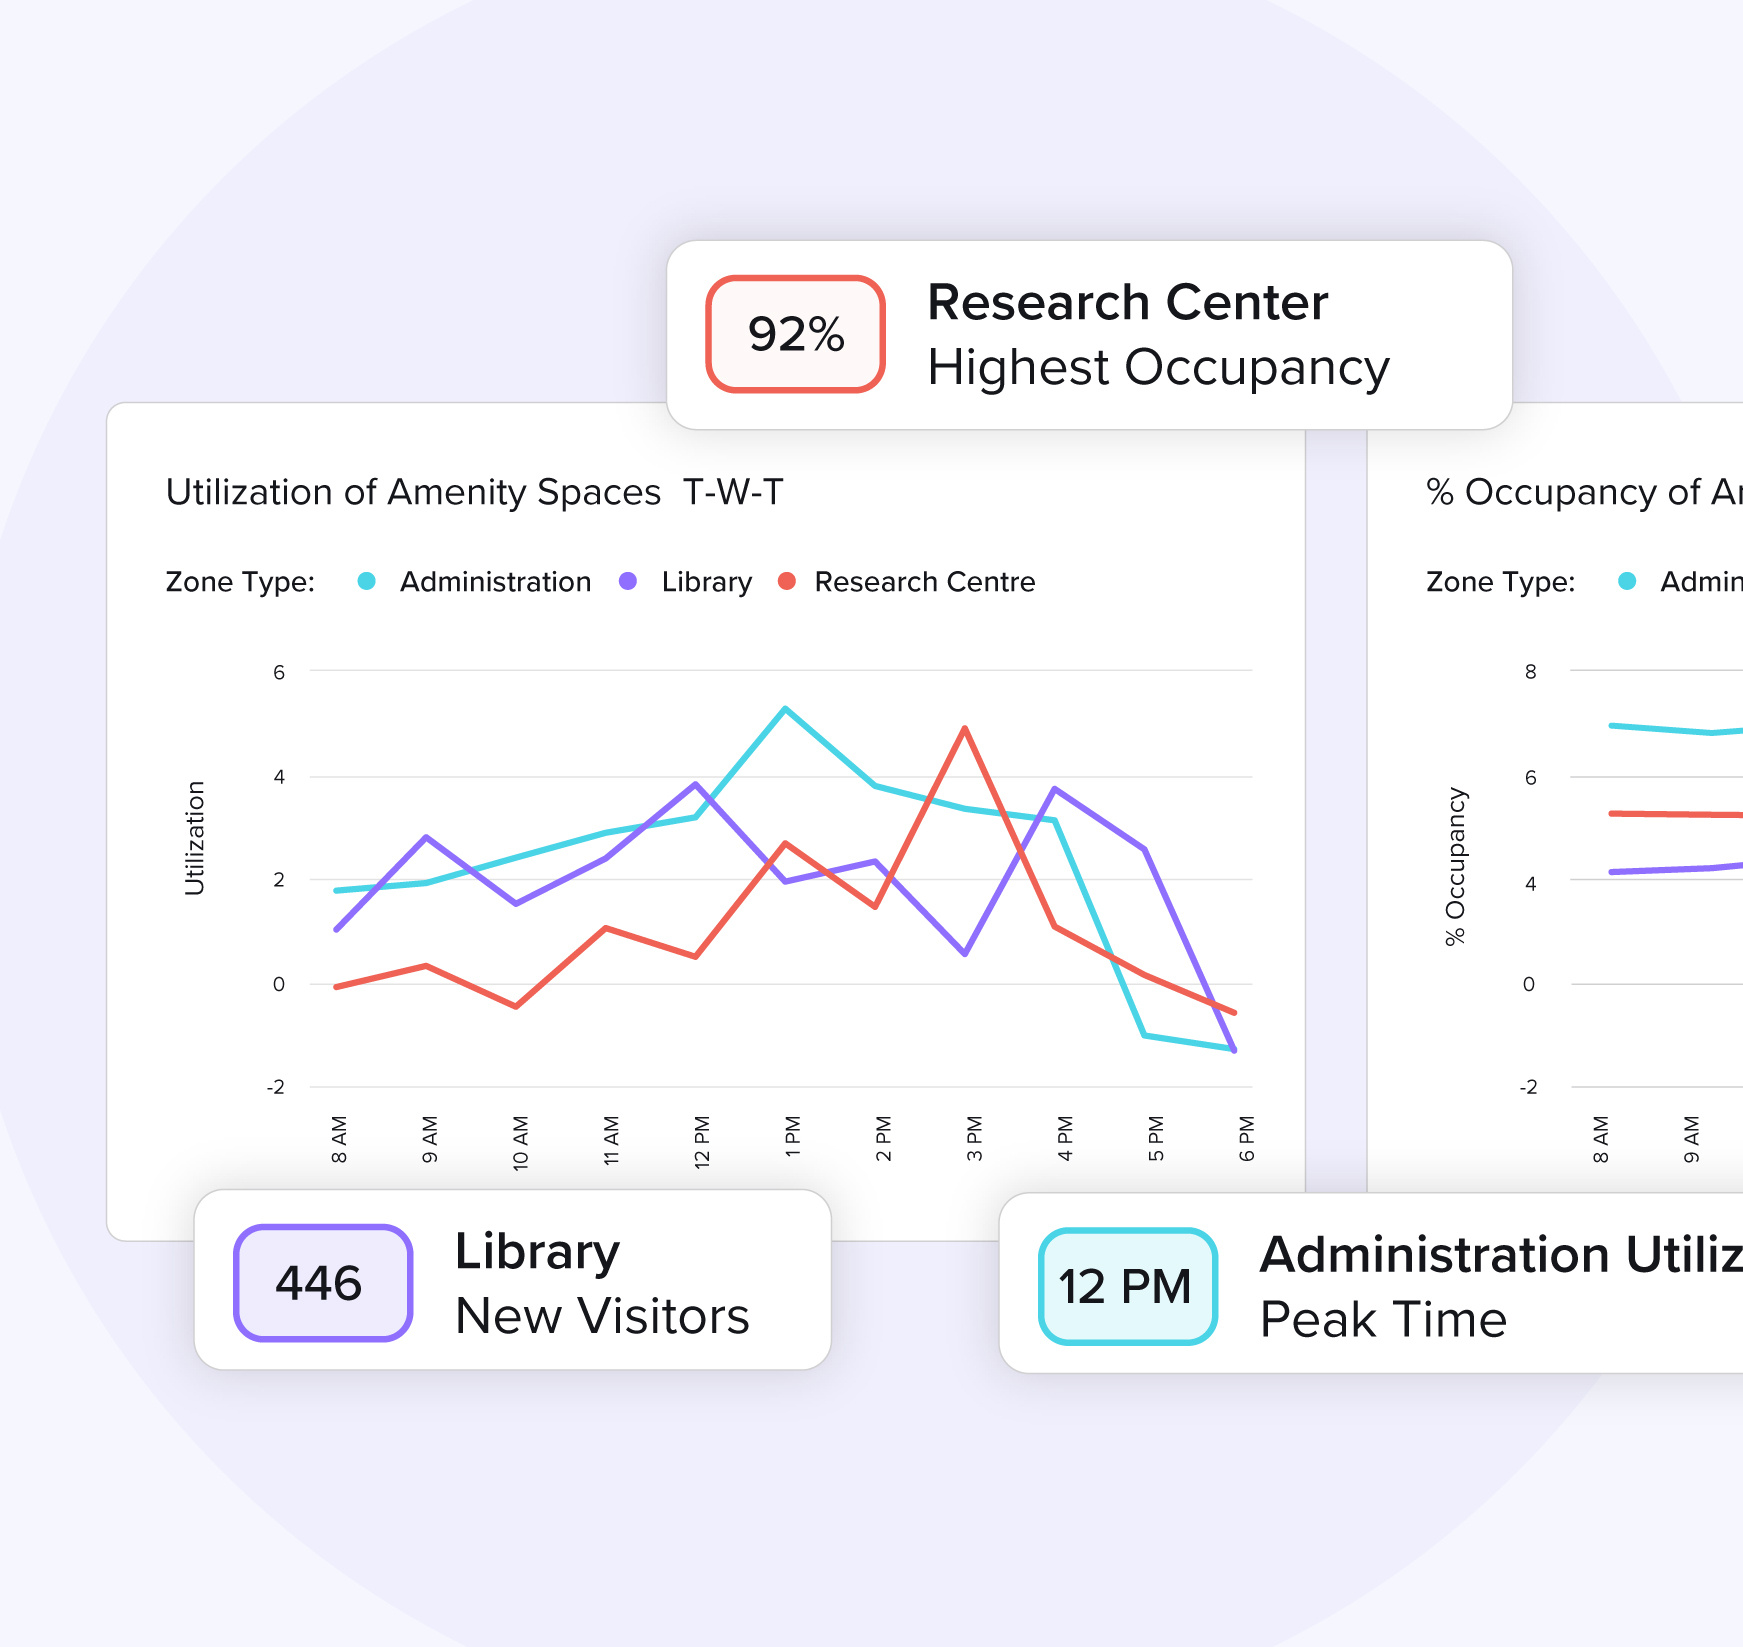
Workplace analytics dashboard visualizing amenity space utilization across the week. Highlights show the Research Center at 92% highest occupancy, the Library with 446 new visitors, and Administration reaching peak utilization at 12 PM. Line charts compare utilization and occupancy trends by zone type.
The InnerSpace Portal delivers powerful insights into how different groups use your space - unlocking cohort behaviors, departmental trends, and useage patterns that drive strategic decisions.


Key metrics include:

  • Group and cohort-based behavior analysis
  • Space utilization across different zones and space types
  • Visit frequency and return rates
  • Time on site (dwell time)
  • Meeting room occupancy and effectiveness
  • Pathways and foot traffic patterns

All this and more without the

need for sensors or hardware.

InnerSpace gives you workplace analytics beyond just people counting

Determine anonymously who is in any area
Show where they are going and where they are coming from

Allow traffic and density to be measured over across your entire office footprint

Understand how people use space, across floors, zones, and entire buildings, to design smarter workplaces

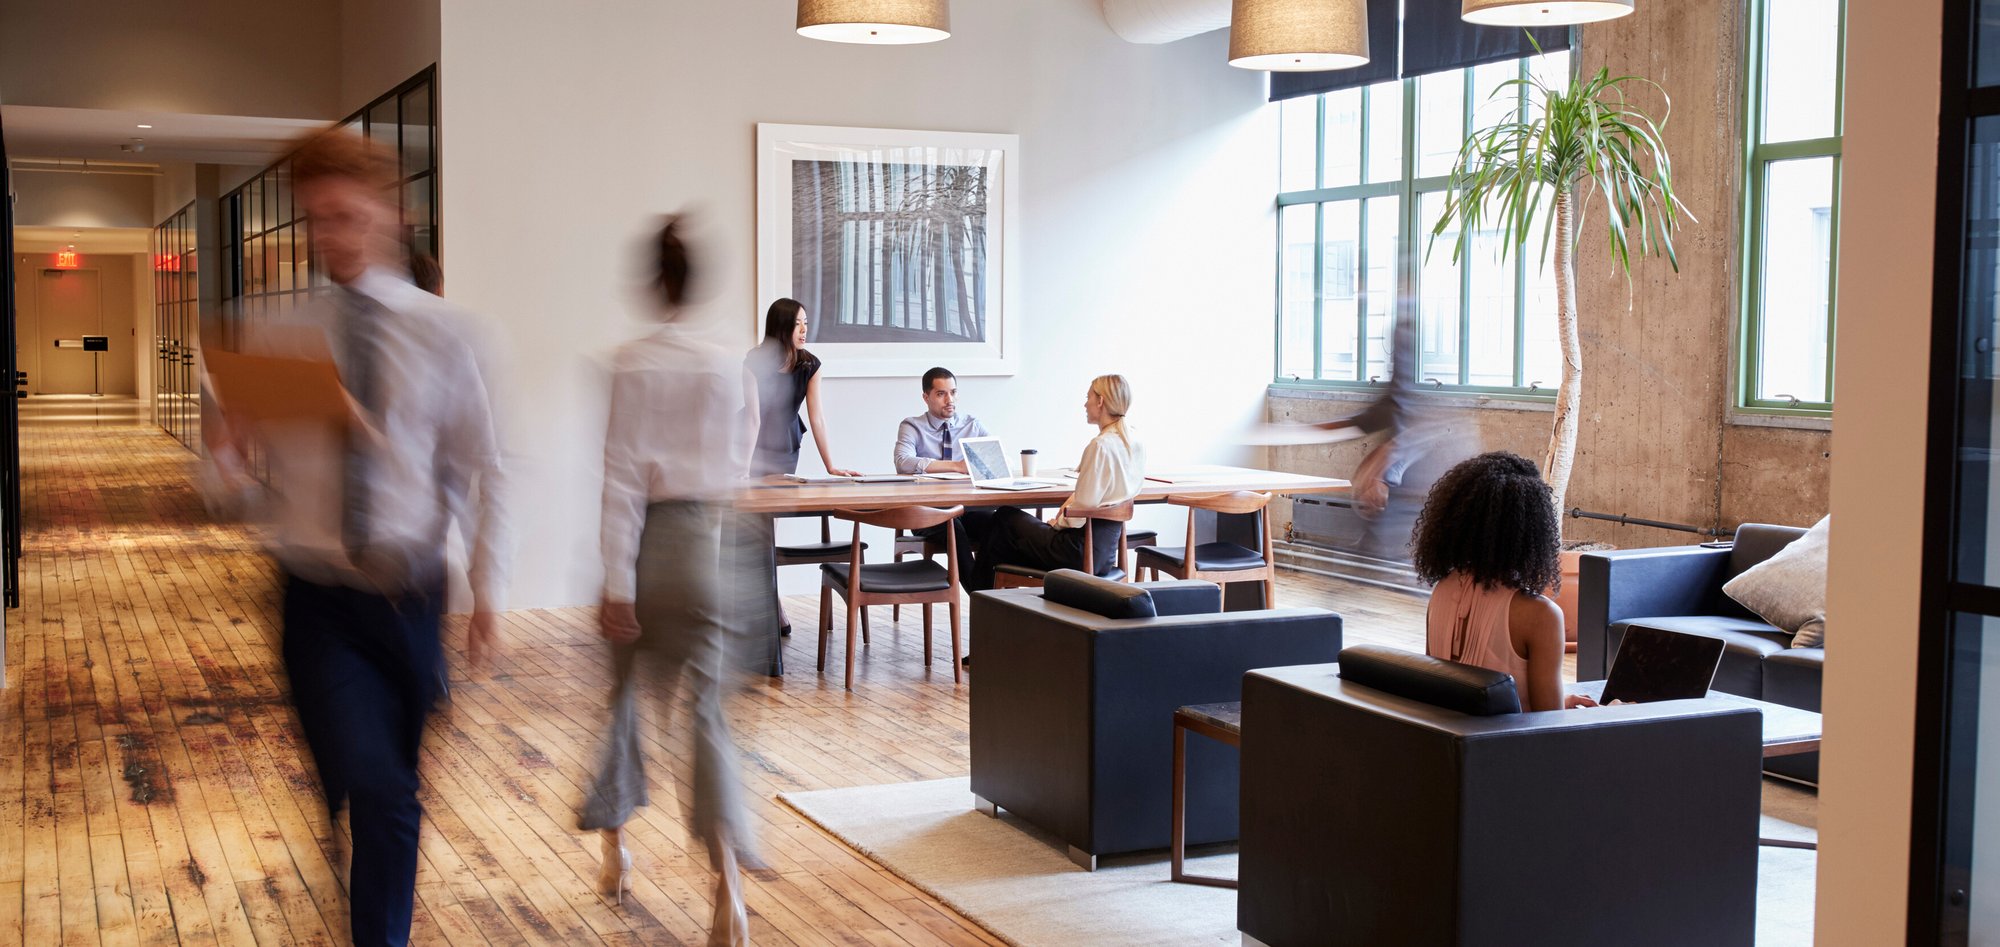
Modern open office with employees collaborating at a shared meeting table while others walk through the workspace or work from lounge seating. Large windows, natural light, wood floors, and flexible collaboration areas create an active, welcoming workplace environment.
How to discover popular pathways in your space

Lorem ipsum dolor sit amet, consectetur adipiscing elit. Nullam tempor arcu non commodo elementum.

How to measure frequency

Lorem ipsum dolor sit amet, consectetur adipiscing elit. Nullam tempor arcu non commodo elementum.

How to know the popular times in the office

Lorem ipsum dolor sit amet, consectetur adipiscing elit. Nullam tempor arcu non commodo elementum.

How to measure people count

Lorem ipsum dolor sit amet, consectetur adipiscing elit. Nullam tempor arcu non commodo elementum.

How to measure people density

Lorem ipsum dolor sit amet, consectetur adipiscing elit. Nullam tempor arcu non commodo elementum.

Explore the power of InnerSpace metrics:

Laptop displaying an InnerSpace workplace analytics dashboard with a flow map visualization. The Sankey-style chart shows how 38 people moved from the Reception Area to the Conference Room, helping organizations analyze movement patterns, traffic flow, and space utilization across the workplace.
How to discover popular pathways in your space
Laptop displaying an InnerSpace workplace analytics dashboard with key occupancy metrics. Widgets summarize total people (222), new people (47), people overview, visit frequency, meeting room utilization, and traffic patterns, giving workplace teams a real-time view of space usage and workplace activity.
How to measure frequency
Smartphone displaying the InnerSpace employee experience app with live workplace occupancy information. The home screen shows a "Very high" occupancy status, capacity metrics, occupancy trends, seating availability, and quick access to maps, bookings, analytics, and workplace services.
How to know the popular times in the office
Laptop displaying an InnerSpace workplace analytics dashboard with people insights. Interactive charts track new, unique, and returning visitors over time, with filters for date, location, and area. The dashboard also summarizes visitor trends and occupancy metrics to help optimize workplace performance.
How to measure people count
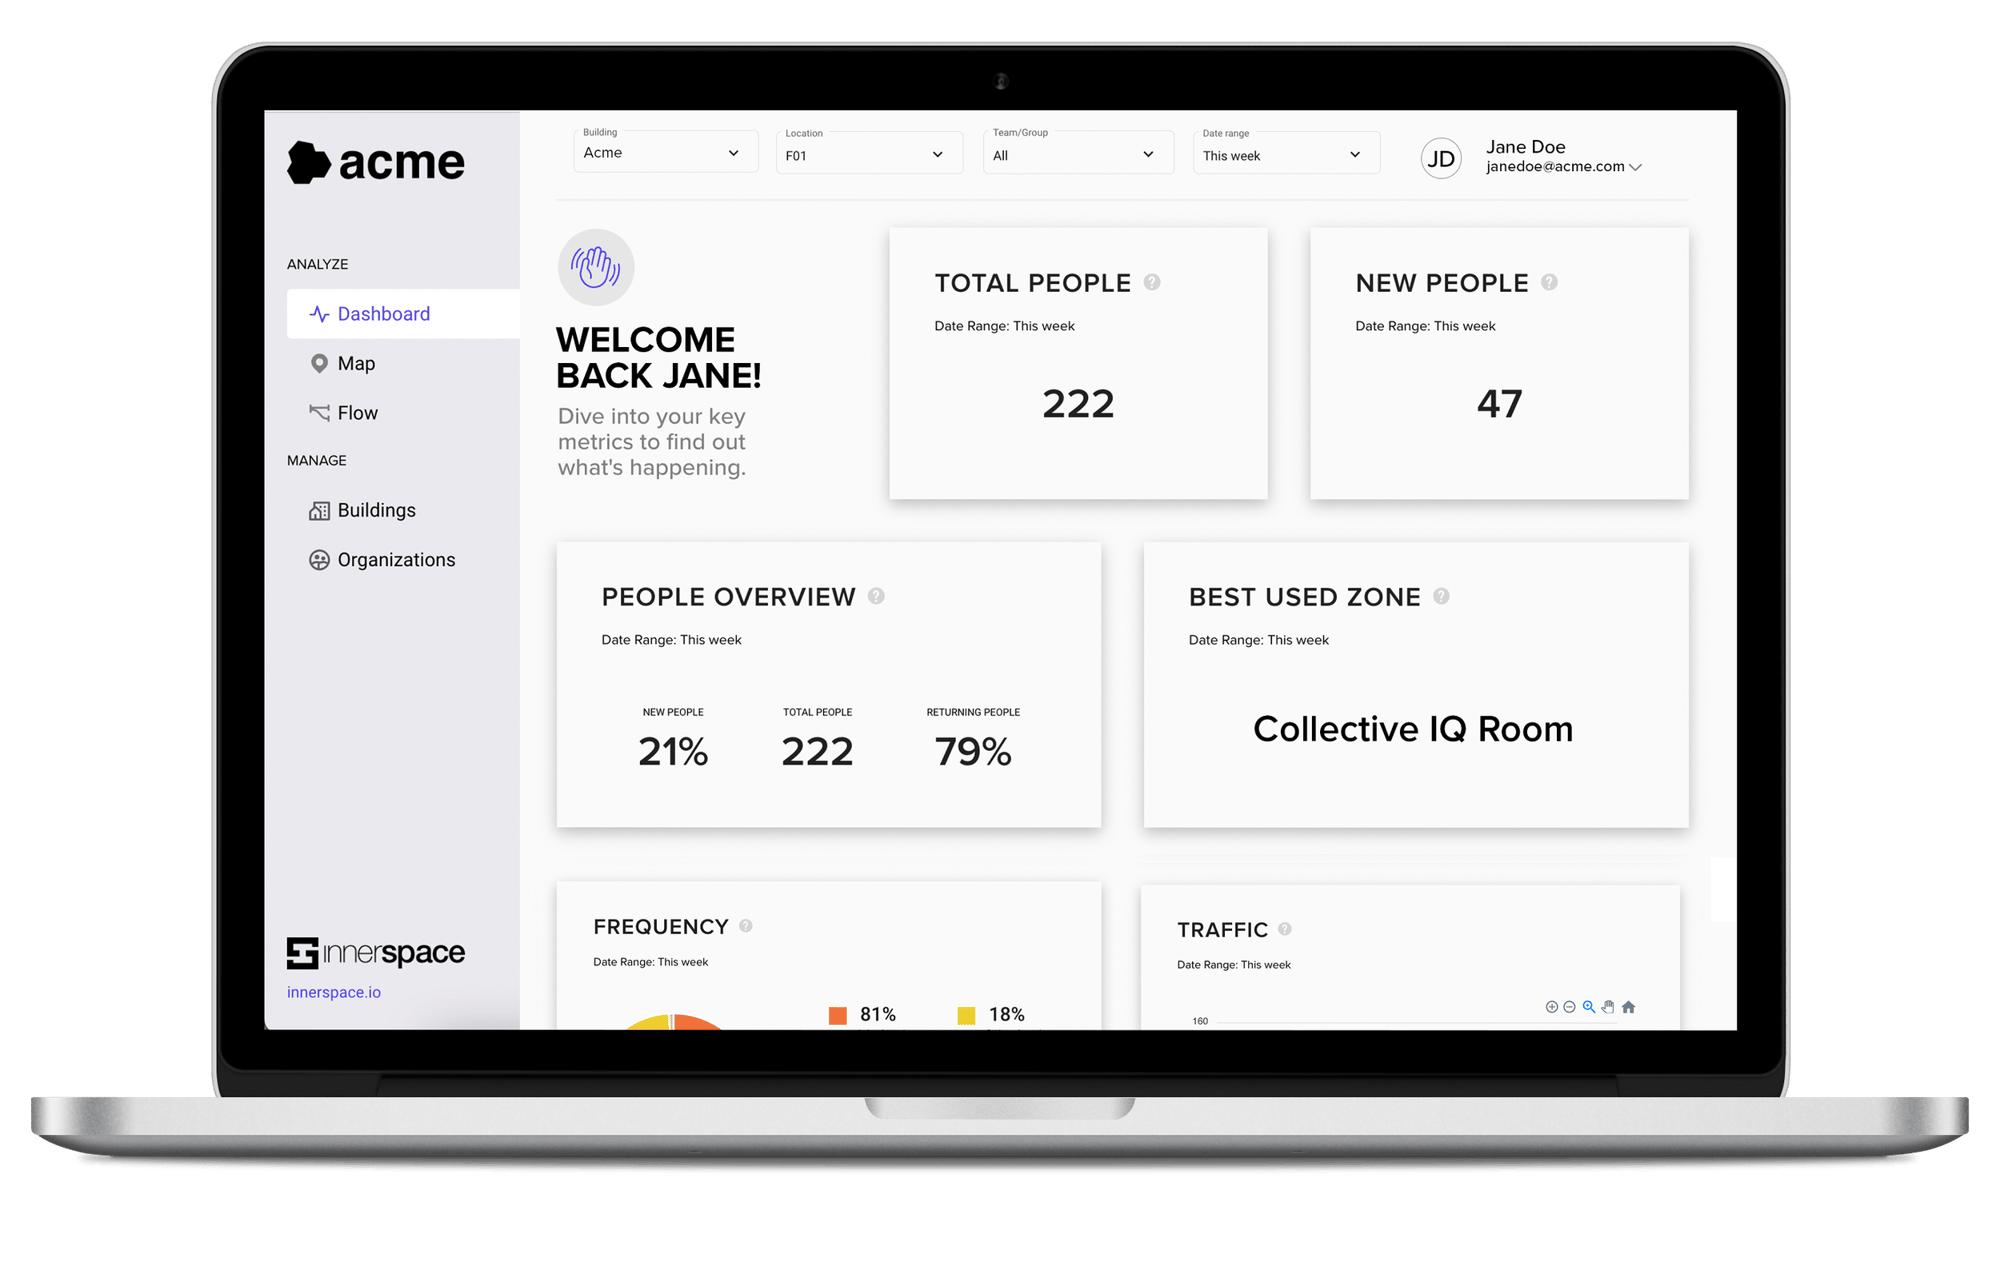
Laptop displaying the InnerSpace workplace analytics dashboard. Key metrics include 222 total people, 47 new people, 79% returning visitors, and the best-used zone, Collective IQ Room. Additional widgets provide frequency, traffic, and occupancy insights, giving workplace teams a real-time overview of building performance.
How to measure people density

From foot traffic to distinct team behaviors

The InnerSpace solutions uses a proprietary Wi-Fi location intelligence engine to generate more accurate location data than traditional occupancy data solutions. Using Wi-Fi for this data has the ability to analyze and present all available metrics by team or group.


Discover our “inside the data” series

Two colleagues collaborate at a conference table in a modern office. A woman smiles while speaking, and a man listens beside an open laptop as another teammate takes notes in the foreground. The bright meeting space features glass walls and a professional, collaborative atmosphere.
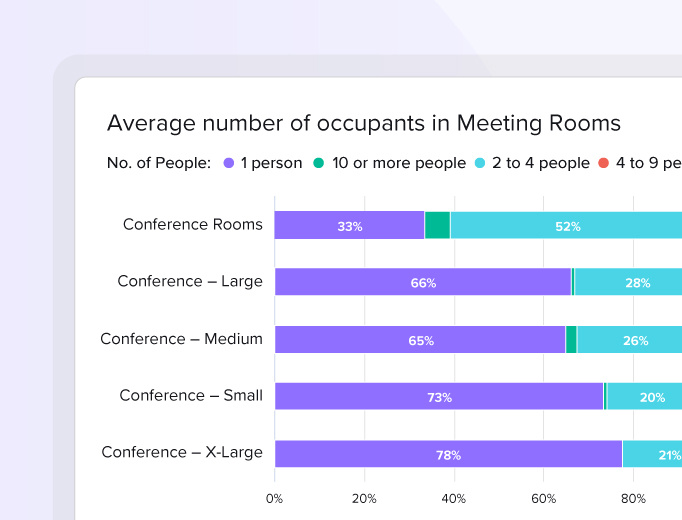
Horizontal stacked bar chart showing the average number of occupants in meeting rooms by room size. Most conference spaces are used by a single person (33–78%), while smaller percentages accommodate 2–4, 4–9, or 10+ people, highlighting meeting room utilization patterns.
Overhead view of three colleagues collaborating around a large architectural blueprint. The team reviews floor plans, points to design details, and uses notebooks, colored pencils, measuring tools, and rolled drawings on a shared workspace, illustrating collaborative planning and workplace design.
Two colleagues sit at a conference table during a meeting in a bright, modern office. A smiling man works on a laptop while a coworker listens beside him. Notebooks and a glass of water sit on the table, reflecting a collaborative discussion in a professional workplace.

Custom reports allow you to measure what matters to you

InnerSpace offers a custom reports feature accessible through our analytics portal, allowing users to gain deeper insights into their space utilization data. Users can build tailored reports to capture the data you need to make informed decisions.


The platform allows you to export raw data for offline analysis in various formats like PowerPoint and Excel, as well as for use with visualization tools such as PowerBI and Tableau.


InnerSpace also provides an open and extensible API, enabling data scientists and analysts to utilize their preferred BI reporting tools for creating highly specific custom reports.

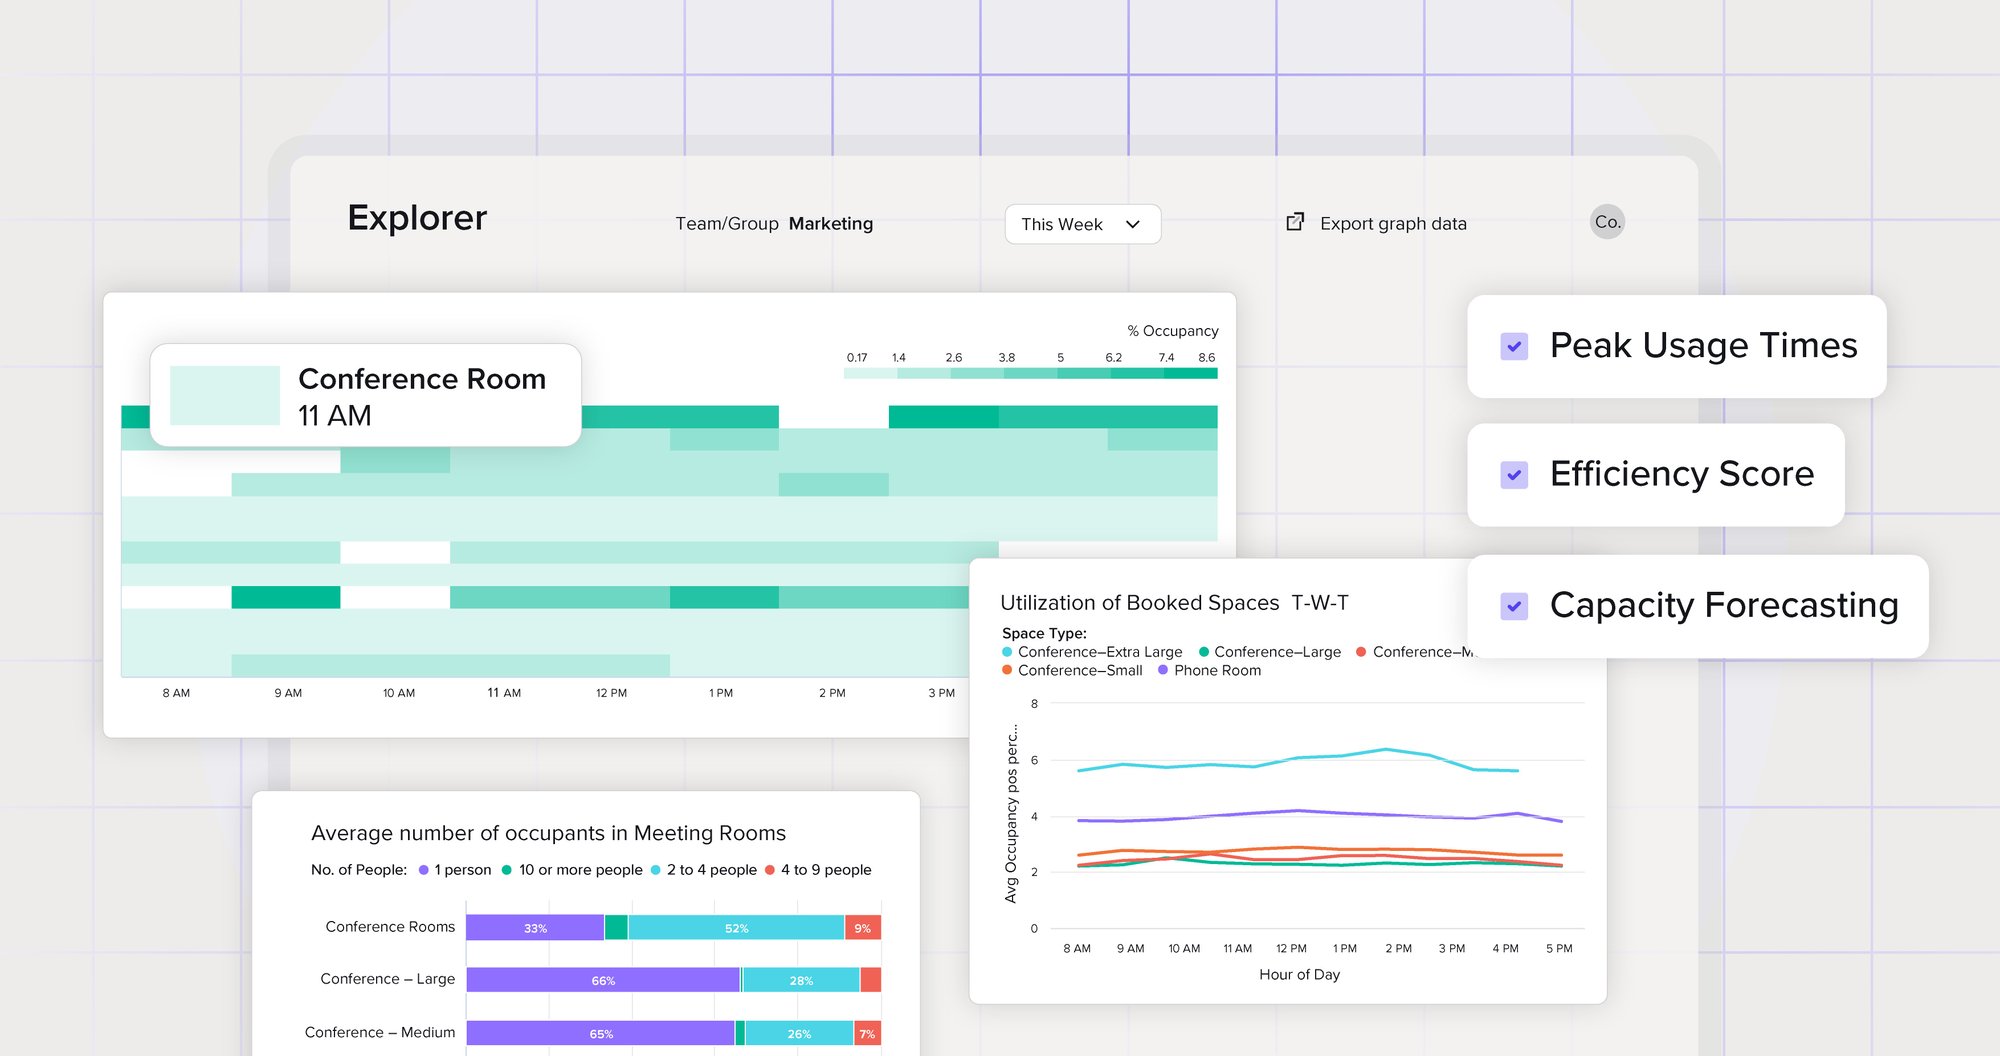
An interactive workspace analytics dashboard visualizes occupancy heatmaps, meeting room utilization, and space performance trends. Key insights highlight peak usage times, efficiency scores, and capacity forecasting, enabling organizations to optimize workplace operations, improve space planning, and make data-driven real estate decisions.

Want to see InnerSpace in action?

Watch a demo to see how InnerSpace delivers deep space utilization insights, beyond simple head counts, to drive meaningful workplace transformation and help your teams thrive.

Make smarter workplace experience decisions with InnerSpace

An overhead view of a collaborative meeting in a modern office shows six professionals gathered around a large conference table reviewing documents, charts, and digital devices. Laptops, smartphones, notebooks, and printed reports are spread across the table as the team discusses ideas and plans in a bright, contemporary workspace.
AdobeStock_1137497556_3510b